


24-9 Gaseous Emissions
In which the E@L contemplates the climate-friendliness of seafood consumption

As a working scientist, I used to love going to the annual meetings of the various scientific societies that I belonged to. Although the main attractions were always the scientific lectures and networking opportunities, the secondary benefit was an endless supply of free seafood. Attending the National Shellfisheries Association meant that I could expect to stuff myself with as many raw oysters as I could eat. The Crustacean Society always put on the biggest crab feed imaginable. And meetings of the American Fisheries Society (of which I was a Chapter President) virtually guaranteed four days of free fish and bottomless mugs of local craft beer. I always took students with me, which were my primary reason for attending (despite said seafood and drink) and managed to cover all the costs from grant funds.
Now that I’m retired, I have given up attending these annual fetes. Not only do I not have graduate students to mentor anymore, but I also lack the grant funding to cover my travel costs. In addition, I’ve been considering the environmental costs of attending such events. The greenhouse gas emissions (GHGE) caused by a single plane flight amount to about 90 kg of CO2 equivalents (CO2e) per hour of travel. So, a round-trip 5-hour flight from Dulles Airport (IAD) to Seattle (SEA) would spew out about 900 Kg of CO2e. As an environmental scientist, I find it increasingly harder to justify such a contribution to global warming. Admittedly, I share that waste stream with 150 other passengers in a typical Boeing 737, so my personal output is only 6 kg for the trip, about equal to the amount of oysters and beer I would consume. But still.
On that same topic, what about the GHGE of the food we eat? I strongly endorse seafood as the healthiest type of protein, but is it climate friendly? Let’s take a look at some data from the United States Environmental Protection Agency database on “Supply Chain Greenhouse Gas Emission Factors”. GHGE factors are weighted averages of the amount of total GHGE produced per dollar spent on a given good or service, as calculated by the EPA, for 1016 US commodities as defined by the North American Industry Classification System (NAICS). From this database, I have extracted the GHGE factors for eighteen industries directly associated with meat production.
To simplify this, I will break it down into six main protein groups: Beef, Pork, Poultry, Sheep, Aquaculture, and wild Fish. Then I will multiply the GHGE factors by the price per lb for examples of each (with a lb/kg conversion), priced at Walmart (except Salmon*), to determine the total GHG per kg consumed:
*From https://wildalaskasalmonandseafood.com/product/wild-caught-sockeye-salmon/
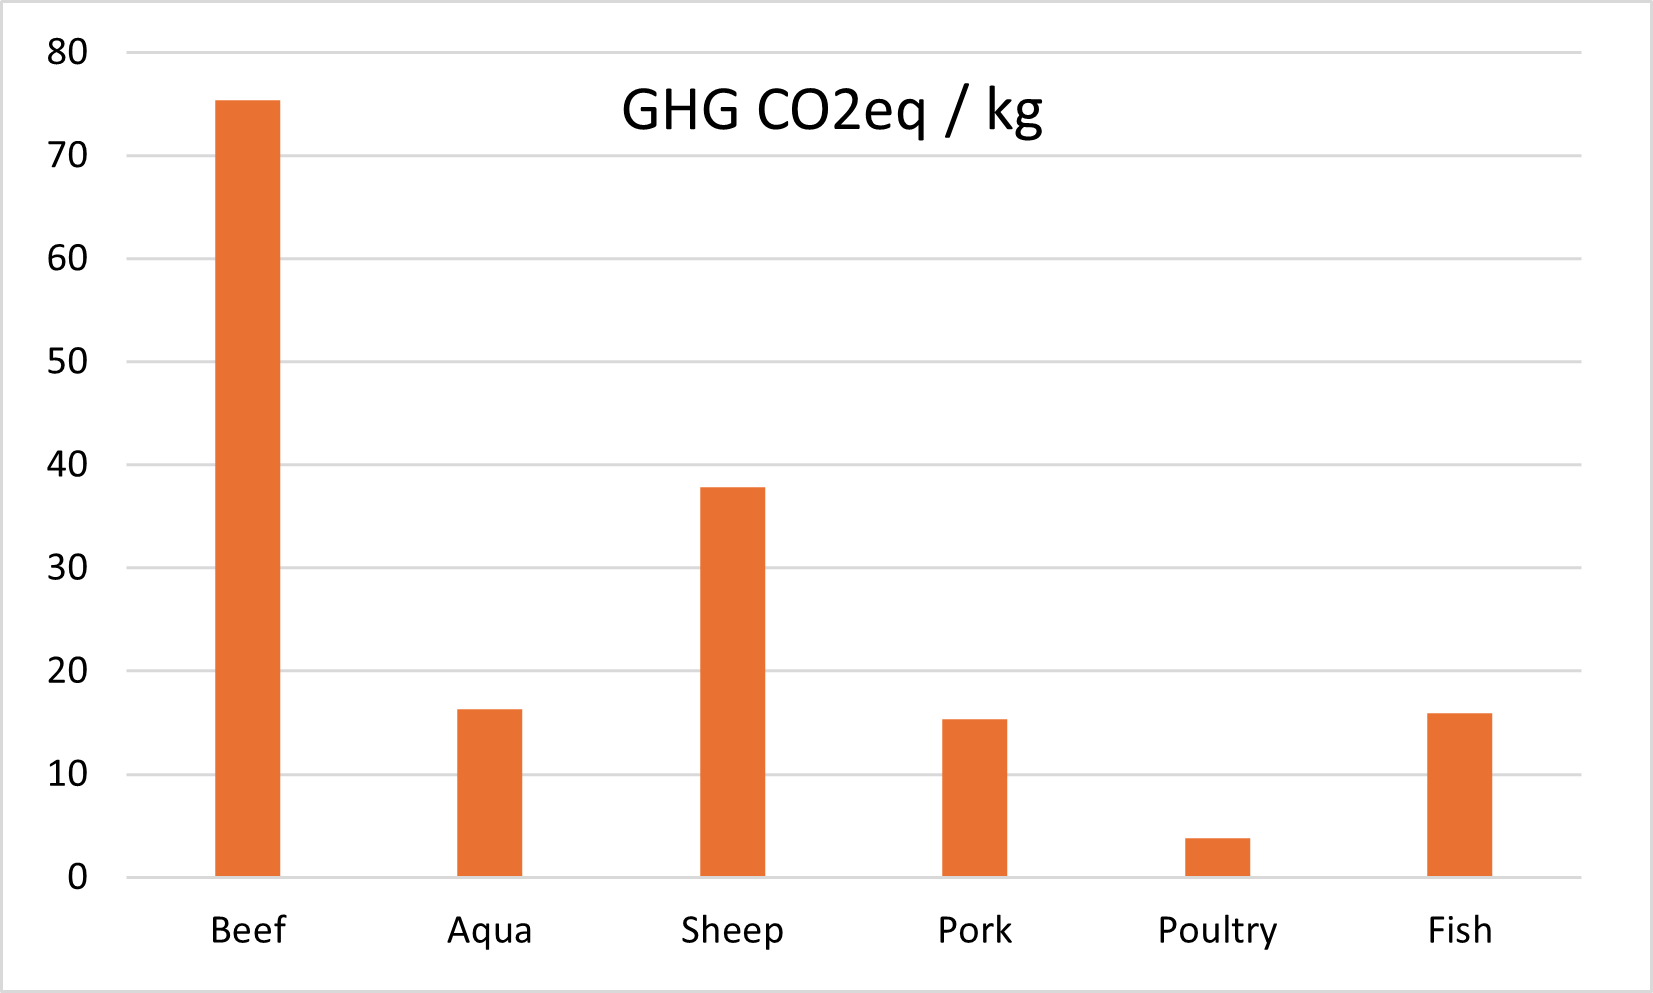
As shown in the figures below, production of beef and dairy cattle produces the most GHGE, with a factor of 3.12 kg CO2e per dollar spent. At $10.97/lb for ribeye steak, beef produces almost 75 kg of CO2e per kg consumed.
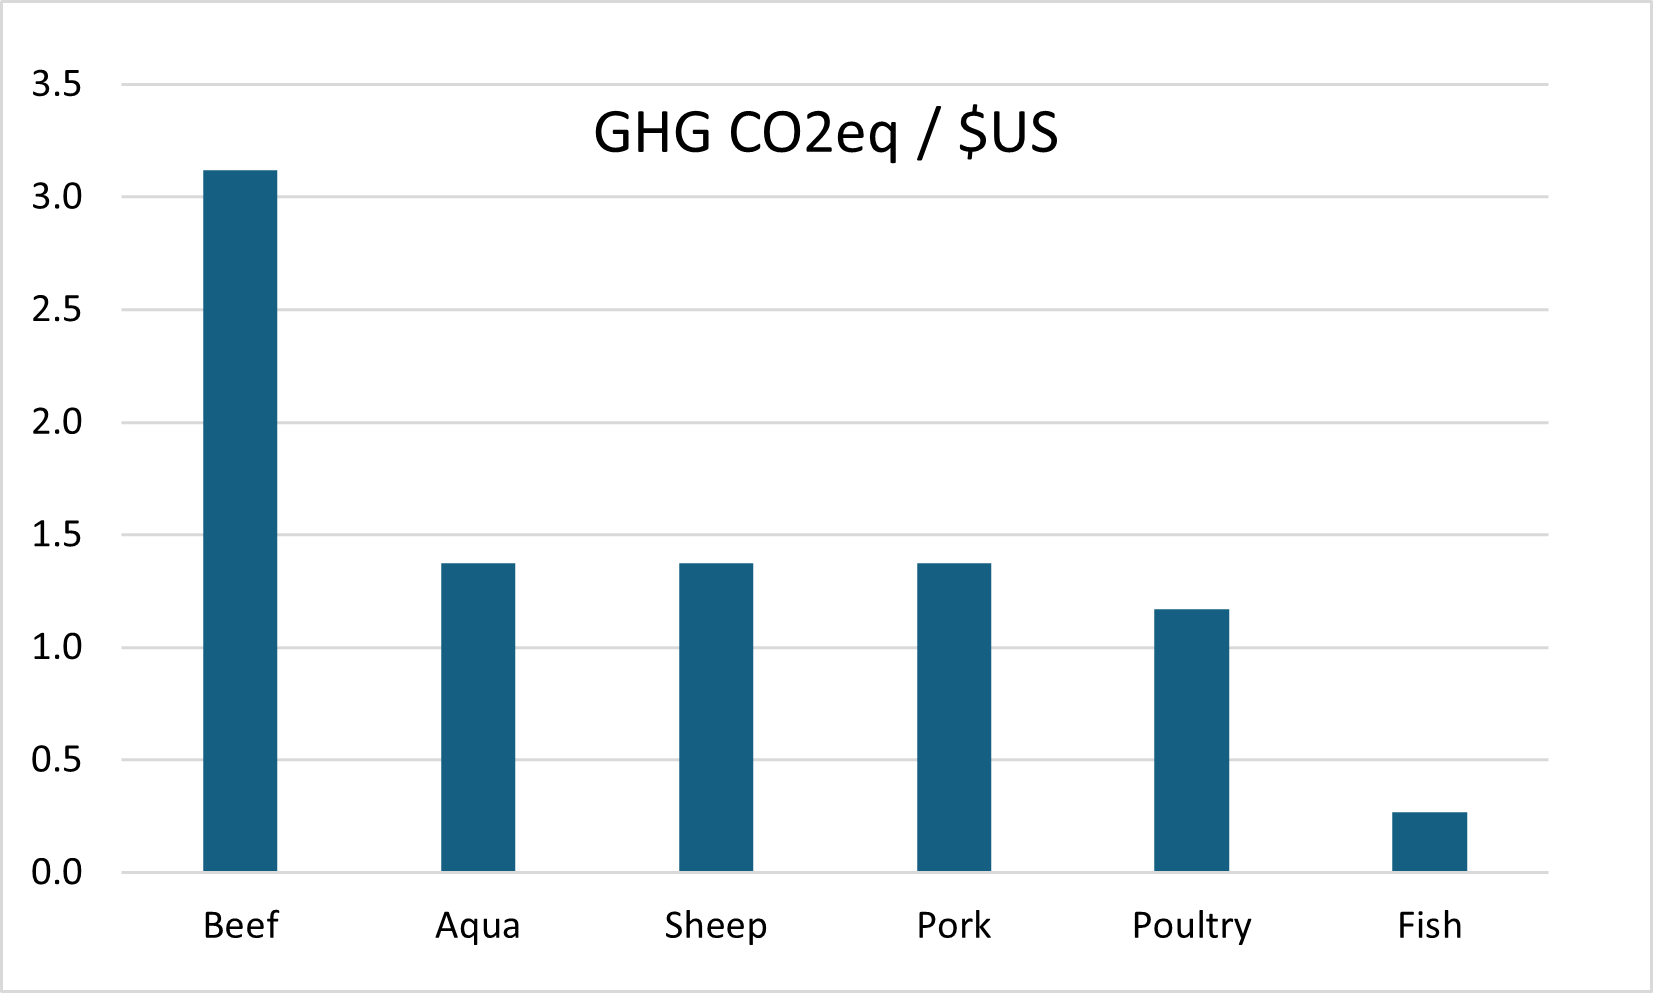
Pork (chops), lamb (chops), poultry (chicken) and aquacultured fish (Tilapia) produce about the same amount of CO2e per dollar spent, but due to price differences, lamb produces about 38 kg of CO2e per kg consumed, whereas pork, tilapia, and wild fish (sockeye salmon) are all about equal at 15-16 kg per kg. Chicken is the most climate-friendly meat, producing only about 4 kg CO2e per kg consumed.
So, as long as I stick to seafood, I can rest assured that continued attendance at my favorite scientific conferences won’t contribute greatly to GHG emissions based on the foods I eat. Especially if I limit my trips to those on my side of the continent in order to avoid air travel. But what about the GHGE associated with my craft beer consumption? I think that’s another story.
This issue of Ecologist at Large is available to all readers. However, if you would like to support my work with a one-off contribution, click “Buy me a coffee” below.
