


Sustainable Seafood, Chapter 2
How much seafood do we catch, and where is it from?

A Surfeit of Seafood
During a recent trip to a big discount store, I spent time perusing the seafood selection. I was amazed at the variety of seafood available, which far exceeded my local grocery store. One entire cooler was filled with farmed salmon from Chile, and another with farmed salmon from Norway. A third included previously frozen wild salmon from Alaska (not being the season for fresh wild salmon). There were filets of Tilapia, Mahi-Mahi, Swordfish, Chilean Seabass, and Red Snapper. There were shrimp from Argentina, Ecuador, Vietnam, and Thailand, and Lobster from Australia and Canada. Faced with such a surfeit of seafood, how does one choose between them? Are they all equally nutritious? Are they all sustainable? Would choosing one over another have some downstream socio-economic ramifications that I should be concerned about?
As consumers of seafood, we need to make informed decisions about what to eat using a variety of criteria. These may include what is available, what is affordable, what is healthy, what is sustainable, what contributes to social welfare, and what has the least environmental impact. And we need other information that supports our decision-making process. How much fish do we catch and eat? Where does it come from? Should we care? Why are some fisheries sustainable while others are not? Are some fish healthier for us than others? Does it matter if the fish is wild, cultivated, fresh, or frozen? In this article I will begin to explore those questions.
Before we embark on this discussion, let’s define a few terms. My use of the term Seafood refers to any consumable items derived from aquatic sources, marine or freshwater. Capture refers to foods caught or taken from wild populations, whereas Aquaculture refers to foods cultivated in defined spaces either indoors or outdoors. Because most of the world records their production in metric tons (tons), I also use those units. As a reminder, one metric ton is 1000 kg, or 2204 lbs, equivalent to a cubic meter of water; 1000 tons equals 2.2 million lbs, and 1 million tons equals 2.2 billion lbs. Much of the data that I cite come from the United Nations Food and Agriculture Organization (FAO) world fishery statistics database. [1]
World Fish Production: How much do we catch?
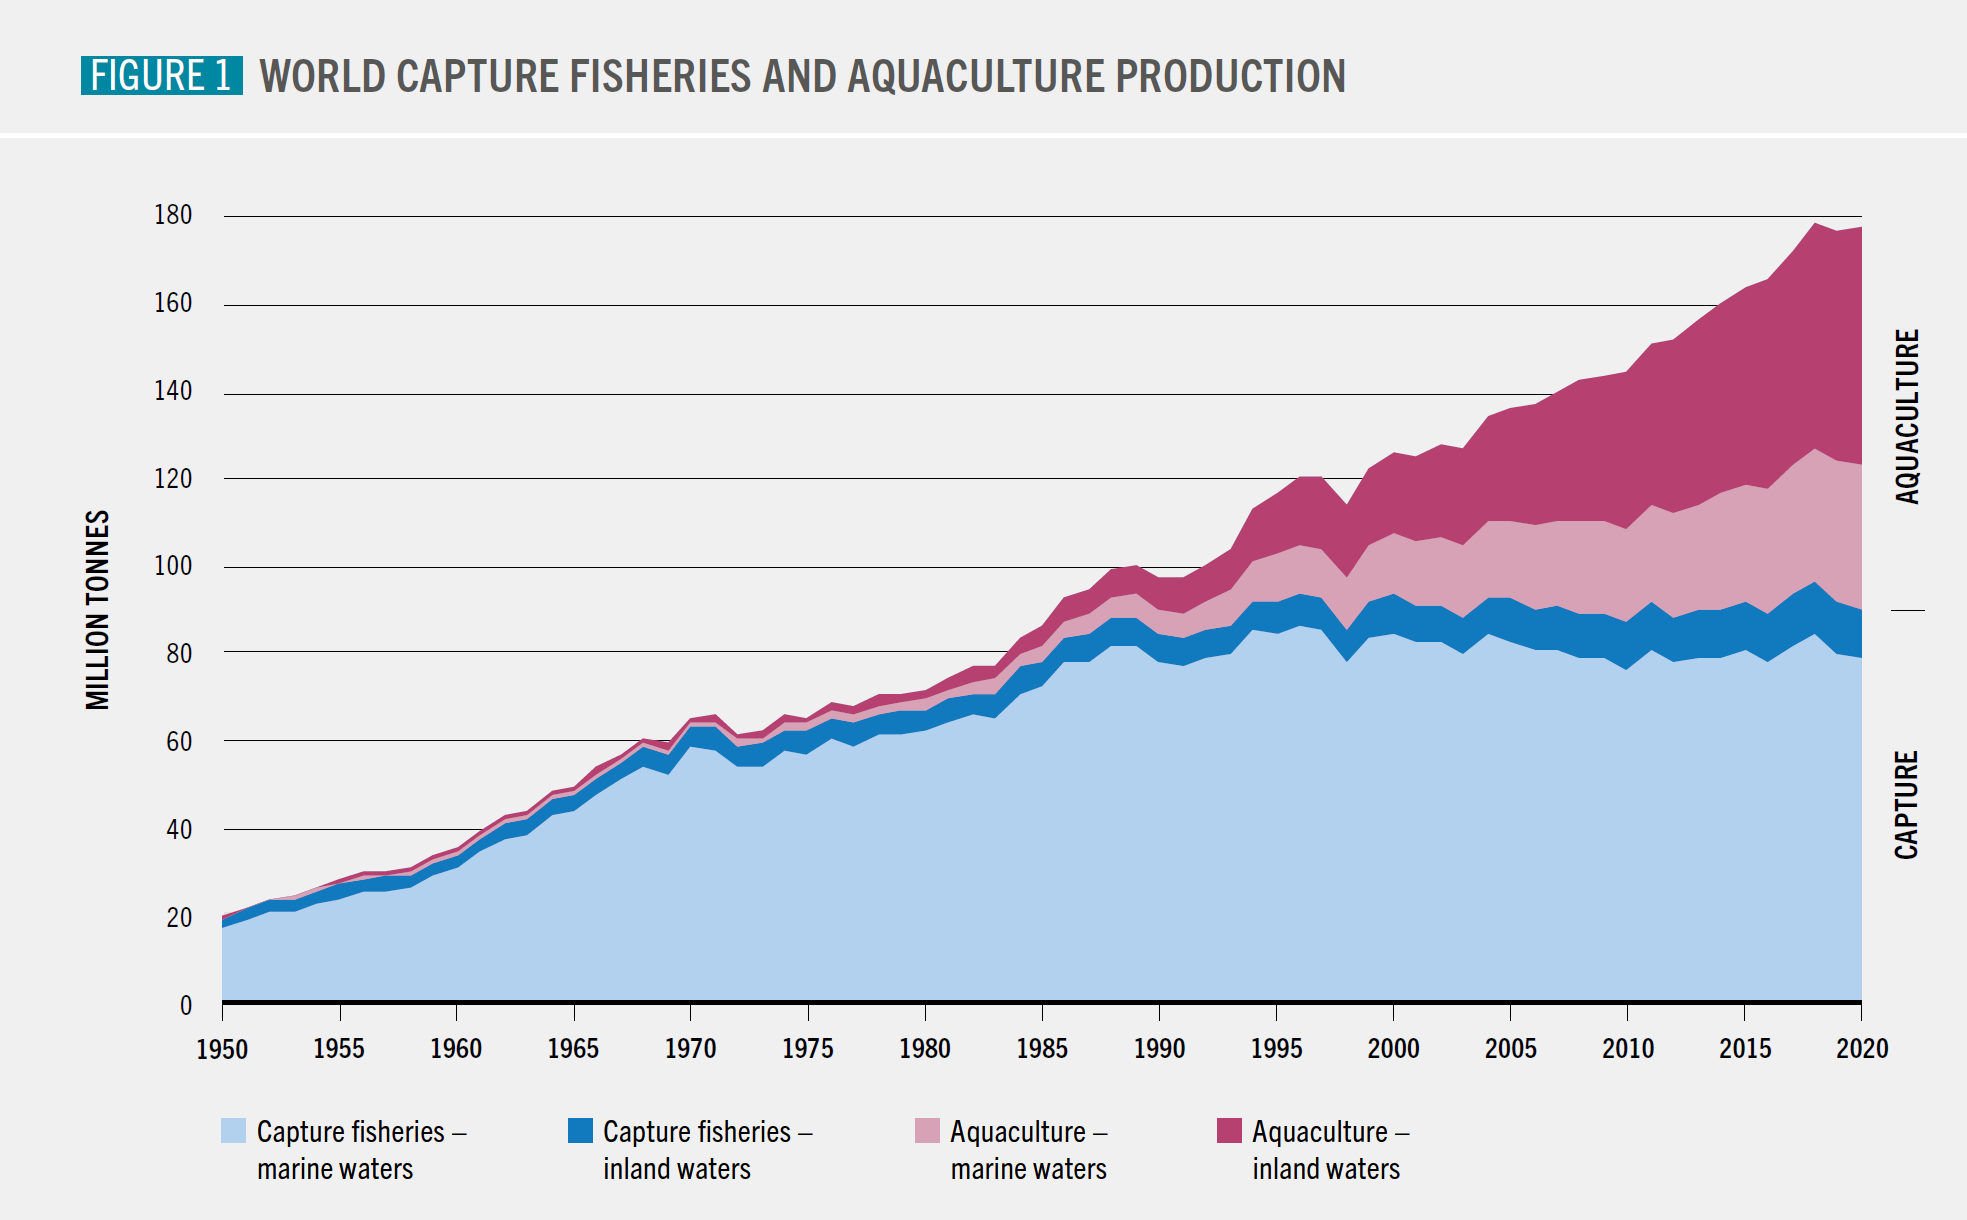
During WWII, fishing activities declined as most of the world’s fishing fleets were converted to military use. One result was that fish populations were given a breather for about 7 years, during which they grew substantially. Following WWII, industrial development increased rapidly as industries converted from wartime to peacetime production. The fishing industry benefited from the introduction of larger vessels, engines, nets, and electronics (especially sonar and loran), and landings increased rapidly. In the 1960s, worldwide fishery landings reached 30 million tons, but scientists still thought fish populations were unlimited, and predicted that landings would increase to 500 million tons per year.
But that’s not what happened. Instead, production of capture fisheries reached about 90 million tons in the 1980s and has been level ever since. Fish populations, as it turned out, were not limitless, and uncontrolled fishing drove many to such low levels as to become commercially extinct. Meanwhile, per capita consumption of seafood doubled from about 10 kg per person in the 1960s to 20.2 kg per person in 2020. In the last 70 years, the world population has grown increasingly dependent on seafood as a protein source. Seafood production now employs 58.5 million people, of which 21% are women.
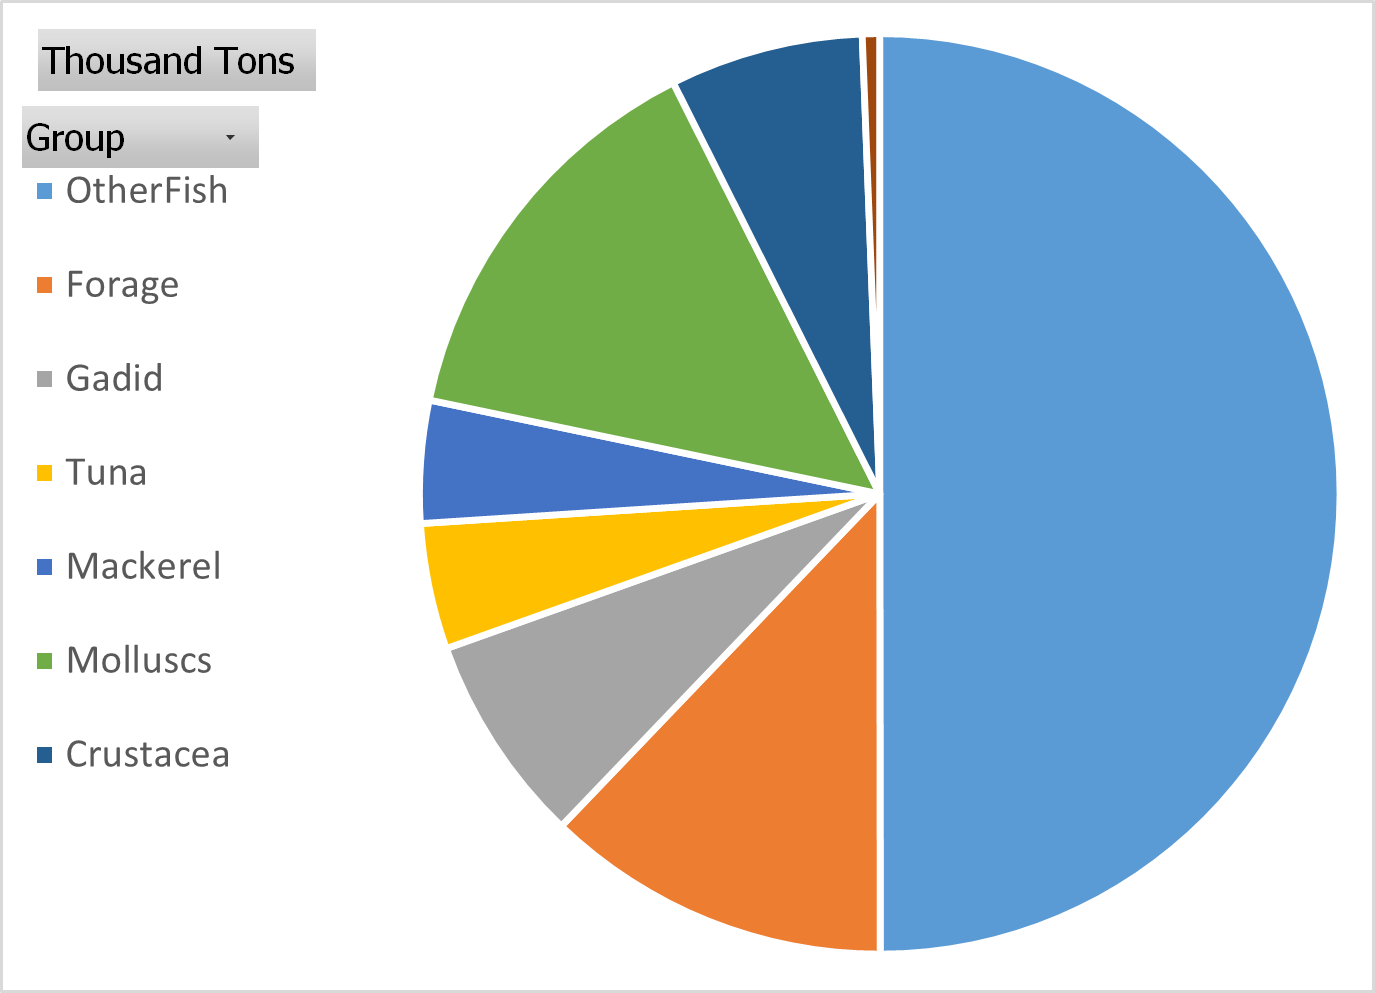
As of 2022, most (78%) of the seafood caught from the wild are fish. About half of that is a mixed bag of species like grouper, snapper, flounder, and reef-fish. After that, the most commonly caught fish are forage fish, including small species such as anchovies, sardines, pilchards, and smelt. Next come the Gadids, including cod, pollock, hake, and their relatives, followed by tuna and mackerel. The worlds largest fishery is for Peruvian Anchoveta, at 4.9 million tons; second is Alaska Pollock at 3.5 million tons. Mollusks make up 15% of the catch, and crustaceans comprise 7%.


The rest of this episode is available to paid subscribers. In it, I will reveal where our fish come from, why some fish populations have collapsed, how“Freedom of the Seas” became “Tragedy of the Commons”, and how fishery management has evolved to prevent this.
Where do our fish come from?
Among the top seafood producing countries, 25% of landings are Chinese, with almost 12 million tons. About half of the catch comes equally from Indonesia, Peru, Russia, USA and India. Much of the rest comes from Southeast Asia, Norway, and Chile; many other countries produce smaller amounts.

In the United States, about 43% of the catch consists of groundfish (fish that live close to the seafloor), including Cod, Pollock, and Hake. Forage fish comprise 21% of the catch; salmon 9%; flounder, shrimp, and other fish about 6% each; and the rest (15%) include crab, squid, and bivalves.

But in fact, the United States imports more seafood than we produce. We import 85% of our shrimp (840,000 tons vs 130,000 tons), 95% of our tuna (over 500,000 tons), and 100% of Tilapia (180,000 tons). This disparity has led to a $17 million deficit in seafood spending.

Aquaculture to the Rescue
In contrast to level or declining production of capture fisheries, development of aquaculture has grown by 6% annually since the 1970s. In 2010, aquaculture production exceeded that of wild capture production for the first time, and by 2022 exceeded 124 million tons. Most seafood aquaculture is being conducted in Southeast Asia, with some occurring in South America, and Africa. Because of labor and land costs, US aquaculture production was only 300,000 tons in 2019, worth $1.4 Billion.
Aquaculture has many positive benefits. Compared to wild capture fisheries, aquaculture has a lower environmental impact, lower greenhouse gas emissions, and a smaller carbon footprint. Aquaculture products may taste different than their wild-caught counterparts, but generally have fewer contaminants. And they cost less. On the debit side, aquaculture operations produce waste that must be discarded, and may displace mangrove beds. Cultivated species can introduce diseases or parasites to wild populations or interbreed with them. In addition, aquaculture requires large quantities of protein, which come primarily from forage fish. On average, 3 lbs of feed are required to produce 1 lb of fish. Aquaculture may also run afoul of human rights issues. In Thailand and China, displaced migrants from Myanmar, and North Koreans, have been used as forced or coerced labor in seafood processing plants.
Why do Fisheries Fail?
Unfortunately, the predictions of scientists in the 1960s never came true. This was partly due to poor management and misplaced optimism, but also due to lack of international cooperation and coordination. During the period of rapid fishery expansion after WWII, governments saw their role as helping to develop fisheries and sustain their economic viability. Regulating or limiting them was not a popular idea. Consequently, many major fisheries suffered spectacular declines during the 20th century.
Fisheries tend to undergo a process of evolution. Many began as “trash fish”, i.e., unwanted items that were caught as bycatch while fishing for larger fish, e.g. cod, and thrown overboard. Often, populations of less desirable fish were large because they had built up over time and were not being exploited. As the abundance of big fish declined, fishermen maintained their incomes by replacing them with the trash fish, fishing down the large standing stocks of unexploited fish. The California sardine (Sardinops sagax) was originally caught for bait, but canned sardines eventually caught on as a food item. Catches rose from a few thousand tons in 1920 to over 600,000 tons in 1945. By 1965 landings had fallen to 24,000 tons, and the fishery was closed in 1968. In response, the boats moved to Peru and began landing anchoveta. That fishery developed in the late 1950s, and produced over 14 million tons in 1970, but collapsed in 1972, following a major el nino event. In the North Atlantic Ocean, Atlantic Cod populations were heavily overfished by Russian and Polish trawlers in the 1950s and 1960s, leading to major declines by 1970, and a complete collapse by 1995.
As populations of large fish declined, fishermen began catching smaller fish that occupied lower trophic levels. This process, called “fishing down the food web” was first described by Daniel Pauly et al. (1998) [2], who concluded that the average trophic level of world fish landings had declined over time. Later scientists have contradicted this theory, and it is still controversial. A similar concept is “fishing down the continental slope”; according to this theory, as shallow, coastal fish populations have become overexploited, we have progressively targeted deeper species and populations.
It may seem obvious, at first, that fisheries decline due to over-exploitation, i.e. overfishing. But climate change also plays a role. As it turns out, sardine populations in California and Japan underwent increases and declines simultaneously, suggesting a Pacific-ocean wide cycle of climate conditions. Sardines and anchovy populations also tend to rise and fall in opposing cycles. We now understand that climate change and climate cycles have a major impact on fish populations, perhaps even more so than fishing.
Unfortunately, we humans don’t have much control over fish populations. We can regulate fishermen, though, and the process of fishing, but that is a relatively new idea that has only been popular for about 50 years. In most cases, scientists just did not have enough scientific information to manage fisheries sustainably. Governments were under a lot of pressure from the fishing industry for employment and income. There was a major emphasis placed on maintaining the livelihoods and continuity of fishing communities, such as Gloucester, Massachusetts, and Kodiak, Alaska. And within those communities, there was major resistance to change.
Freedom of the Seas = Tragedy of the Commons
Part of the problem stems from the ancient belief that the seas are a common property resource. The idea of “Freedom of the Seas” was first espoused by the Dutch East India Co., who wanted their ships to sail by the coastlines of other European countries on their way to the spice islands of India and Southeast Asia without interference. They claimed that all nations and vessels should have free and equal access to the seas for travel, fishing, and commerce. Other countries eventually adopted this policy, but there were exceptions, such as, don’t get too close to OUR shore, or catch fish in OUR historic fishing grounds. For that reason, nations enacted a three-mile limit of sovereignty, which was the distance a cannonball could be fired from the shoreline.
While this arrangement may have been workable for ships traversing coastlines, it did not work for fish, which were often caught in international waters. Common property resources always lead to the “Tragedy of the commons”. When everyone can use a common resource, no one is responsible for maintaining it. Any user who can extract more of the resource does so at little cost to themselves, but at a cost to all of the other users. This is a zero-sum game that leads to higher competition and wasted resources.
Freedom of the coastal seas as a policy was discarded in 1977 when the US and other countries declared exclusive economic zones (EEZs) out to 200 nautical miles. Many people considered this equivalent to the fencing of the open range. At that time, most fisheries were open access; anyone who could afford a boat and fishing gear could participate. The Tragedy of the Commons persisted, resulting in overcapitalization, essentially too many boats and fishermen chasing too few fish. Even though we now owned more of the ocean than ever before, fish populations continued to decline.
Toward the end of the 20th Century, fishery managers began to implement rights-based management. In this system, access to a resource is divided among users based on their recent production history. These portions may be called Individual Fishery Quotas (IFQs) or Individual Transferable Quotas (ITQs), or “Qs” for short. Once awarded, they can be traded, sold, or transferred, within limits. In some fisheries, groups of fishers or boats form cooperatives or sectors that work together to catch a group quota. Many people resisted the implementation of ITQs, claiming that it was privatizing of public resources. But rights-based fisheries generally perform better than fisheries managed from the top down. When each fisher has a right to catch a specific amount of fish, they can make better decisions about when to fish. Rather than having to rush out and catch their fish at the same time as other fishers, they can time their fishing to take advantage of the weather, prices, vessel and gear conditions, and other factors. The “race to fish” became less of a marathon, and more of a sustained walk.
Around the world, implementation of rights-based fisheries has led to stability of landings and fewer boom-and-bust fisheries. This is a major step towards the goal of achieving long-term sustainability. As informed consumers, it behooves us to support those fisheries that are sustainable, and to avoid buying fish produced by non-sustainable activities. In the next chapter, we will explore this topic in detail. What does it mean to be sustainable? How can we know if a fishery is sustainable?

[1] FAO. 2022. The State of World Fisheries and Aquaculture 2022. Towards Blue Transformation. Rome, FAO. https://doi.org/10.4060/cc0461en
[2] Pauly, D., Christensen, V., Dalsgaard, J., Froese, R., & Torres, F. (1998). Fishing Down Marine Food Webs. Science, 279(5352), 860. https://doi.org/10.1126/science.279.5352.860
Thank you for this tutorial; I’ve been trying to purchase only sustainable seafood, but even here in Northern California it’s not always straightforward. Looking forward to your next installment.